XpertHR Absence survey 2016
Results from XpertHR Absence survey 2016 has found that the national median absence rate in 2015 was 2.6%, which translates to 5.8 days per employee. Among the 602 survey respondents that provided data on absence rates, the national average stood at 2.8% of working time, equivalent to 6.3 days per employee.
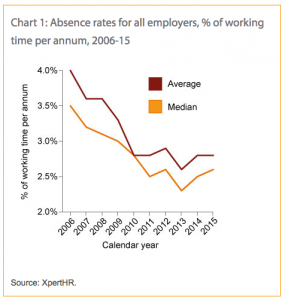
Median vs Average absence rates
Both CIPD and XpertHR surveys use the median value to give the most representative figure across the survey responses. A median figure excludes the extremely high and extremely low answers and therefore is seen as more accurate for an overview.
10-year trend
Over the last 10 years, when XpertHR has conducted the survey, the overall trend has been a reduction in absence. However, compared to the previous year, 2014, absence rates were slightly up as shown in this chart:
Public sector and facilities management have highest absence rates
By broad sector, employers in the public sector face the highest levels of sickness absence. Among private-sector-service organisations, employers operating within facilities, security and support services experience the highest rates of sickness absence – an average of eight days per employee per year and a median of 8.4 days.
XpertHR also reported that employees working in the food, drink and tobacco industry have the most sickness absence within the manufacturing and production sector – a median of 8.8 days per employee.
Only 40.7% record cost of absence
Not all organisations record their cost of absence. Among the 40.7% of respondents, who were able to provide figures, the absence survey 2016 reports a median cost of absence of £455 per employee in 2015. This compares with a median of £367 in 2014, and £408 in 2013. By contrast, the average cost of absence was £837, showing a big difference between the numbers reported by different organisations.
This cost was higher among public-sector employers where the median cost is £819, due to the higher incidence and frequency of absence within this sector, combined with the greater likelihood of contractual sick pay being higher than the statutory amount.
Differences in calculating cost of absence
Organisations use different methods to calculate the cost of absence. The main cost that is recorded is sick pay. Other costs should also be included, such as replacement staff, management time and lost productivity. Among the survey respondents:
- 15% (23 organisations) measure overtime costs for other staff covering for absent individuals
- 10.5% include the fees/wages of temporary staff providing cover for absent employees
- 10.5% measure costs arising from reduced performance, reduced customer service or missed business opportunities
Same respondents every year?
In 2015, the survey received 670 responses. 56 of the respondents from last year’s survey were matched to responses from same organisations this year. Among these 56, there was virtually no change. The median rate had lowered by 0.1% and averages were exactly the same as last year.
It would be interesting to find out how many overall have completed the survey year after year. Companies with established absence management procedures and good data collection are likely to enjoy lower and more stable absence levels.
Sample size for cost of absence still disappointing
The total number of responses in this year’s survey was 661. Only 602 were able to provide data on absence levels and only 269 had data on costs. Although the respondents altogether employ more than 1.5 million staff, the sample size especially in terms of data on costs of absence continues to be small. Honeydew maintain the opinion that most organisations that struggle with high absenteeism, will not be able to provide reliable data. They are therefore unlikely to participate in the annual surveys.